 Kore AI
Your quant analyst, in a chat.
Ask it about a ticker's gamma, the skew, the levels or a historical pattern. Kore answers with figures from Artisaner's quantitative and statistical data; it never makes them up.
Start freeKore AIHow's QQQ gamma looking today?
Zero hallucination
It only cites levels and metrics that come from the data. If the data isn't there, it tells you; it never invents it.
Real options data
Gamma, skew, open interest and historical patterns from the market's real positioning.
Answers with context
It embeds the matching chart and hands you the levels ready to paste into the indicator.
Generic AI vs. Kore
The difference is the data.
A general-purpose AI improvises an answer. Kore only cites what's in Artisaner's data.
Generic AI
Makes up the figures
Hands you a confident percentage with nothing behind it.
Stuck in the past
Its knowledge froze months ago; it doesn't know yesterday's close.
Generalizes
"It usually tends to…". No figures, no sample, no ticker.
Doesn't know your market
Can't tell QQQ's positioning apart from NVDA's.
Kore AI
Only figures from the data
Every number comes from Artisaner's reports. If it's not there, it says so.
Last-close data
Real gamma, skew and open interest from the latest session.
Reads each ticker
Concrete positioning for QQQ, SPY, NVDA and the whole universe.
Levels for your chart
Call wall, gamma flip and put wall ready to paste into the indicator.
How it works
From question to insight in three steps.
Ask in plain language
Talk to it like a colleague: "how's QQQ gamma?"
It queries the real data
Kore pulls from Artisaner's quantitative data; it never calculates or guesses.
Answer with numbers and context
Exact figures, the embedded chart and the levels to copy.
Use cases
Whatever your style.
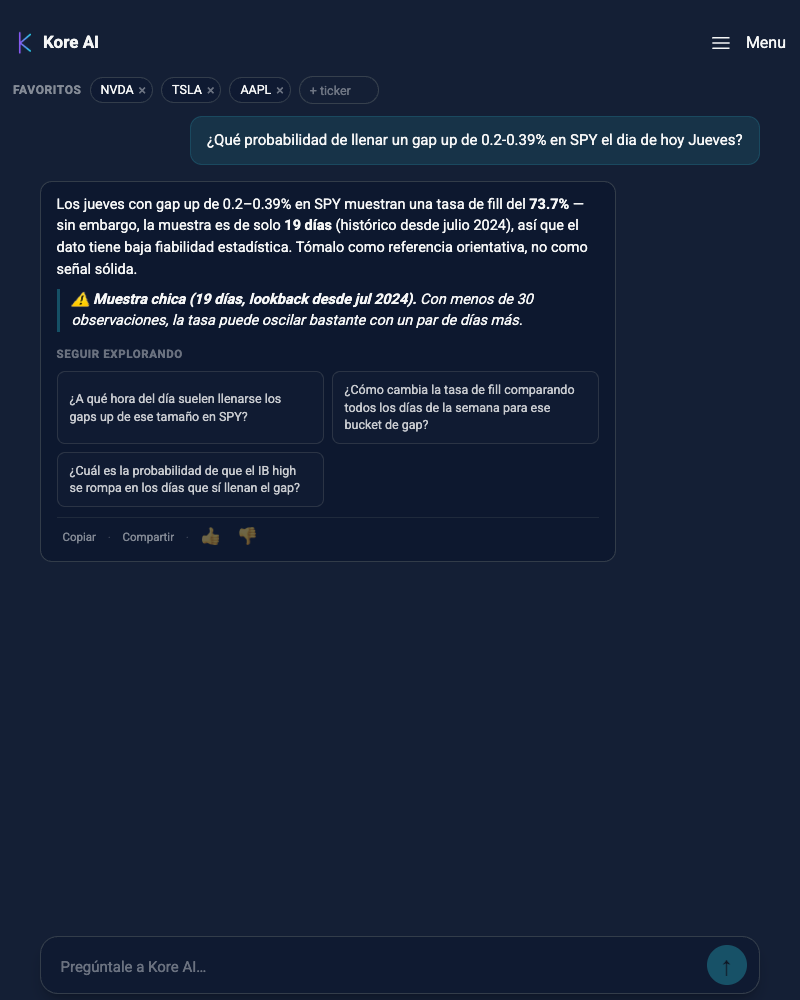
The gap trader
“What's the probability of filling a 0.2-0.39% gap up on SPY?”
Historical fill rate + breakdown by day of the week.
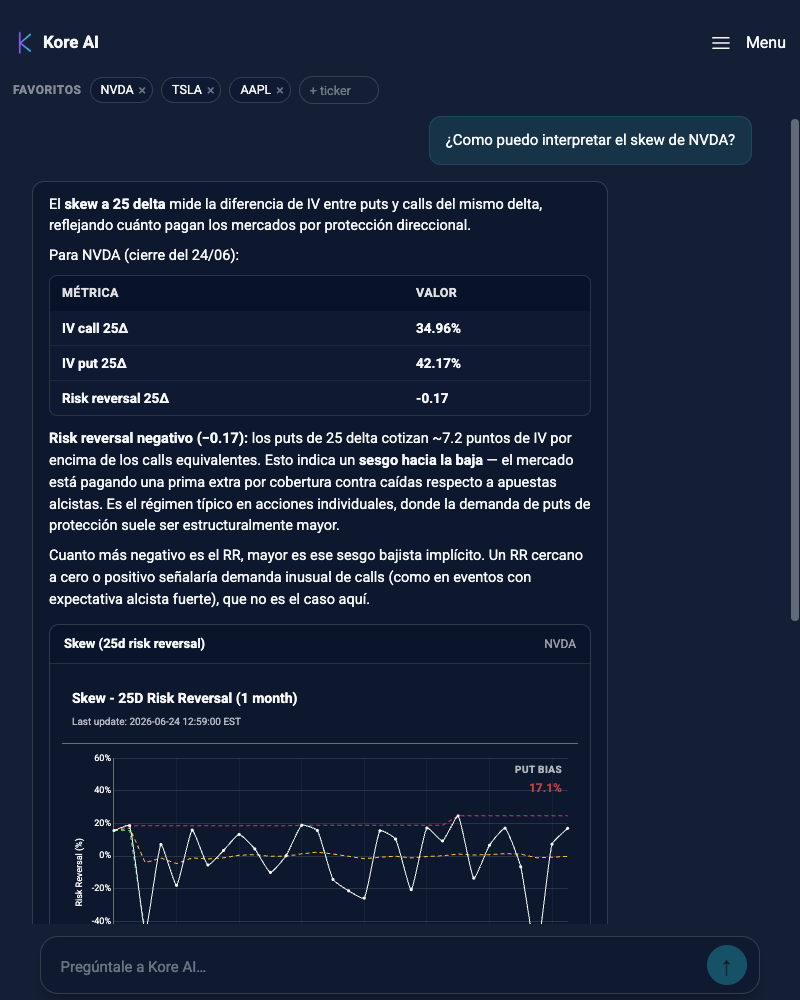
The options trader
“Interpret NVDA's skew”
25d call/put IV, risk reversal and regime, with the chart.
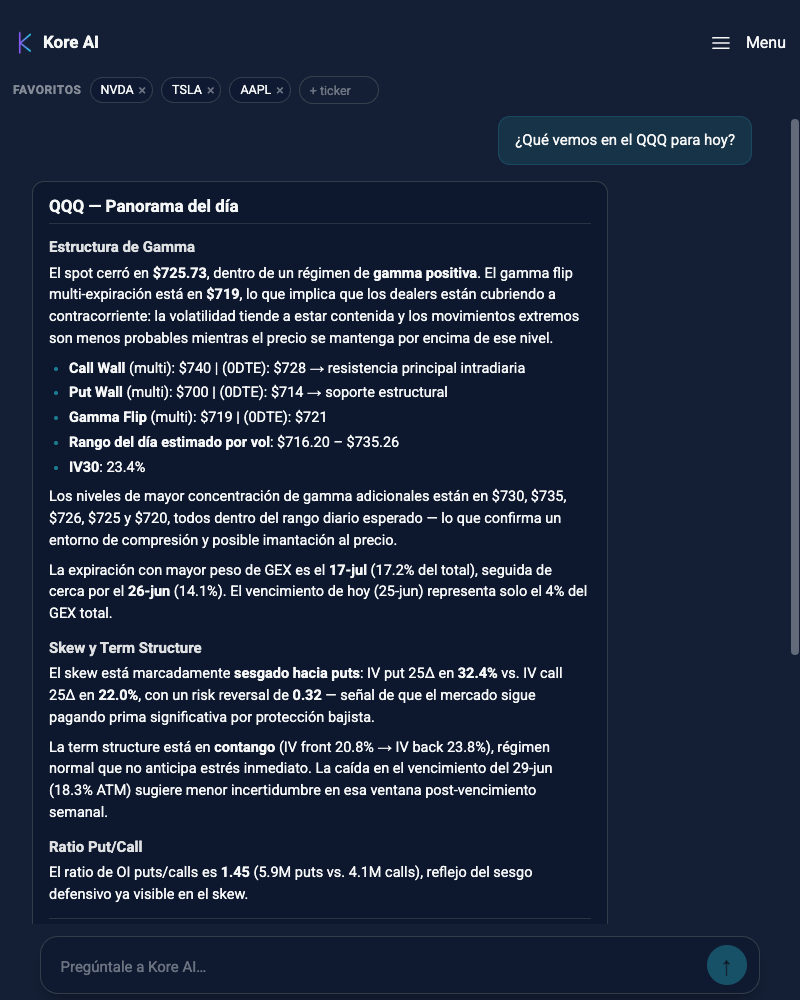
The day trader
“What are we seeing on QQQ today?”
Gamma, walls, flip and key levels from the last close.
100%
traceable to Artisaner's data
EOD
last-close data
0
guesswork